
 Product
 Brand
Brand Articles
 Tools
Tools
2026 DRAM and the 3-to-1 HBM Rule: Market Supply Analysis and B2B Procurement Guide
Summary: This technical report explains how the physical "3-to-1 wafer penalty" of High Bandwidth Memory (HBM) production has cannibalized standard DRAM capacity, causing severe shortages of DDR4 and DDR5 in 2026. As major hardware OEMs pass these soaring component costs directly to enterprise buyers, procurement teams must abandon Just-in-Time models in favor of rolling safety stocks and strategic long-term distributor agreements to protect budgets.
Tags: DRAM Price Trends, B2B Procurement, HBM Market Impact
Author: AI Agent
High Bandwidth Memory (HBM) allocations for artificial intelligence accelerators are restructuring the global dynamic random-access memory (DRAM) market, triggering a structural supply crunch for enterprise server and PC memory modules in 2026.
This technical report analyzes how the physical "3-to-1 wafer penalty"—where manufacturing one bit of HBM3e consumes roughly three times the silicon wafer area of standard DDR5—has forced major fabricators to reallocate cleanroom capacity away from conventional memory products. According to market data from TrendForce, this structural displacement drove conventional DRAM contract prices up by 93% to 98% quarter-over-quarter in Q1 2026, followed by a 58% to 63% increase in Q2 2026. Consequently, Tier-1 original equipment manufacturers (OEMs) including Dell, HP, and Lenovo have implemented 15% to 20% sequential price hikes on enterprise hardware, with high-density server memory quotes increasing by up to 300%. To protect operational margins and guarantee component availability, enterprise procurement teams are pivoting from Just-in-Time (JIT) stocking models toward 3-to-6-month rolling safety stocks and distributor-managed allocation agreements.
II. The Engineering Mechanics of the 3-to-1 Wafer Trade Ratio
The severe contraction in standard DDR4 and DDR5 supply is not the result of an unforeseen surge in consumer PC demand or temporary supply chain disruptions. Instead, it is driven by a fundamental silicon-level manufacturing trade-off known as the 3-to-1 wafer trade ratio.
       300mm Silicon Wafer Capacity Allocation
+-------------------------------------------------------+
|  1 Wafer Allocated to HBM3e/HBM4                      |
|  (Requires TSV Etching, Base Die, 8-16 Layer Stacking) |
+-------------------------------------------------------+
                           =
+-------------------------------------------------------+
|  3 Wafers Displaced from Standard DDR5 Production     |
|  (Planar Architecture, High Yield, Fast Throughput)  |
+-------------------------------------------------------+
Physical Wafer Penalties: Die Size, TSVs, and Base Logic Layers
Producing High Bandwidth Memory (such as HBM3e and emerging HBM4) requires significantly more raw silicon than manufacturing conventional planar DRAM. According to February 2026 benchmark reports from Micron Technology and OpenMetal, allocating a 300mm silicon wafer to HBM3e displaces the exact wafer surface area that would otherwise yield three standard DDR5 die units.
This 3-to-1 conversion penalty stems from three distinct physical constraints:
Expanded Die Surface Area: An HBM die requires micro-bump arrays and thousands of Through-Silicon Via (TSV) vertical channels etched directly through the silicon. These structural requirements expand the physical die footprint by 50% to 60% compared to a standard DDR5 die of equivalent density. Larger die dimensions directly reduce the total net die count achievable per 300mm wafer.
Dedicated Base Logic Dies: Unlike standard DDR5 modules—where memory controller logic sits on the system motherboard or CPU—an HBM stack depends on a dedicated foundational logic die (base die) manufactured on its own dedicated wafer line to interface directly with host GPUs or ASICs.
Complex Processing Steps: TSV formation requires complex deep-reactive ion etching (DRIE) and CMP (chemical-mechanical planarization) steps, extending cleanroom processing times per wafer by more than 40% compared to standard planar DRAM flow.
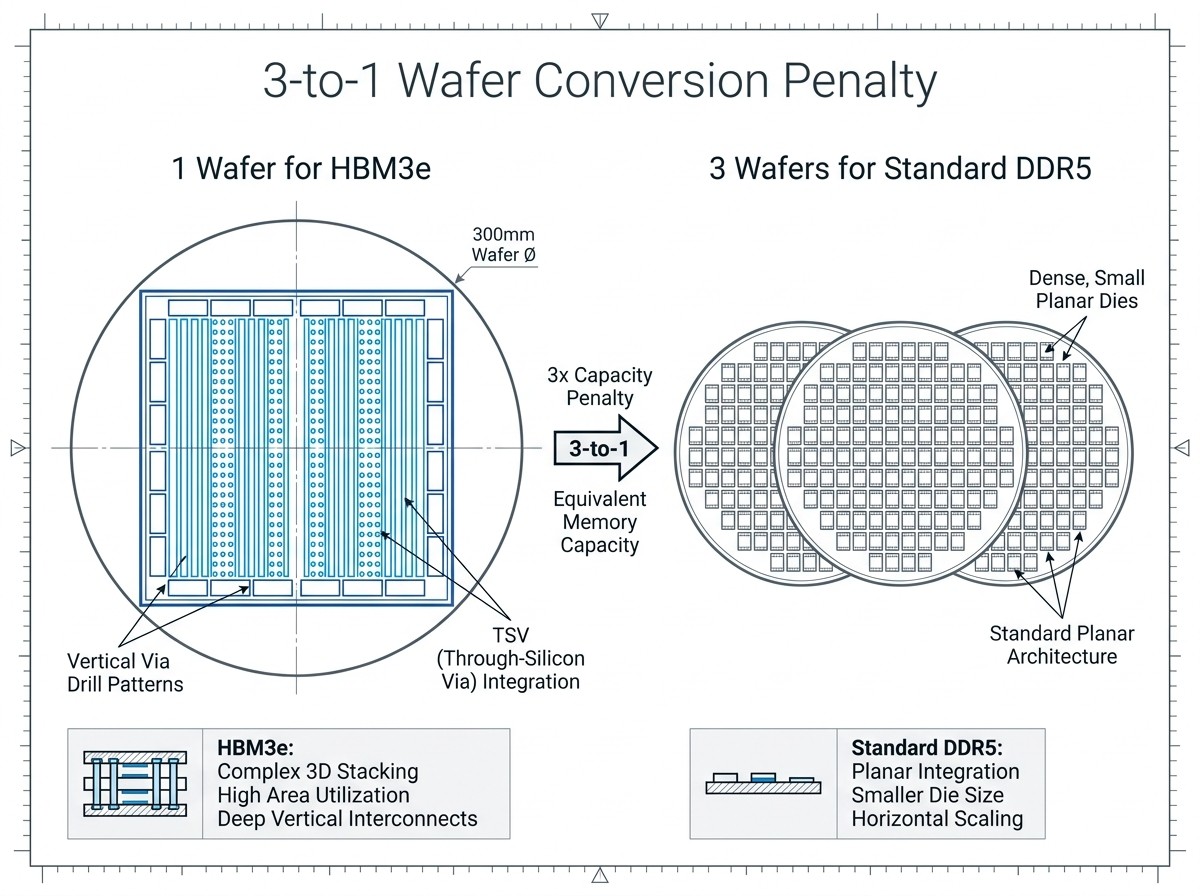
Stacking Architecture and Compounding Yield Loss
In visual architecture models comparing standard PCB-mounted DRAM with 3D-stacked memory, standard DDR5 relies on single, flat dies surface-mounted side-by-side. In contrast, HBM3e stacks 8, 12, or 16 individual DRAM dies vertically over a base logic die, interconnecting them using tens of thousands of microscopic TSV bonds.
Standard DDR5 vs. HBM Vertical Stacking Architecture

Standard DDR5 (Flat PCB Assembly):
+-----------+  +-----------+  +-----------+
|  DRAM 1   |  |  DRAM 2   |  |  DRAM 3   |
+-----------+  +-----------+  +-----------+
------------------- PCB -------------------

HBM3e (3D Vertical Stack):
+-----------------------------------------+
|  DRAM Die Layer 12 (Top)                |
+-----------------------------------------+
  |||||||| TSV Interconnects ||||||||
+-----------------------------------------+
|  DRAM Die Layer 1                       |
+-----------------------------------------+
  |||||||| TSV Interconnects ||||||||
+-----------------------------------------+
|  Base Logic Die                         |
+-----------------------------------------+
---------------- Silicon Interposer -------
This vertical architecture introduces severe compounding yield loss. If a single micro-bump or TSV connection fails on the 12th layer of a stack during thermo-compression bonding, the entire 12-die assembly is rendered unusable. If individual die yields sit at an optimistic 90%, compounding those odds across a 12-layer stack yields a net finished stack efficiency of under 28% without extensive redundancy screening. Consequently, semiconductor fabrication plants must allocate up to 400% more raw wafer starts to guarantee the same net bit output of finished HBM compared to standard monolithic DDR5.
Cleanroom Reallocation and Legacy Line Conversion
Because cleanroom square footage and extreme ultraviolet (EUV) lithography tools are finite capital assets, memory manufacturers—primarily Samsung, SK Hynix, and Micron—have systematically reallocated their operational capacity. Advanced cleanroom footprint previously dedicated to mass-market DDR4 and DDR5 wafer output has been converted to support HBM wafer processing and advanced 3D packaging lines.
Because fabrication plants are operating at over 98% nominal utilization to satisfy AI accelerator demand, standard memory production faces a hard physical constraint. Standard DRAM capacity is falling not because manufacturing capacity is idle, but because cleanrooms are fully utilized producing high-margin HBM.
III. 2026 Memory Pricing Trends: Contract Rates and Super Cycle Dynamics
The structural reallocation of wafer capacity created a steep upward pricing curve across both spot and contract markets throughout early 2026.
2026 DRAM Contract Price Increases (QoQ)
+-------------------------------------------------------+
| Q1 2026: +93% to +98% QoQ                             |
| (Total Industry Revenue: $97 Billion)                 |
+-------------------------------------------------------+
| Q2 2026: +58% to +63% QoQ                             |
+-------------------------------------------------------+
| Q3 2026 (Projected): +13% to +18% QoQ                 |
+-------------------------------------------------------+
Quarterly Price Trajectories Across Q1, Q2, and Q3 2026
According to market data published by TrendForce in June and July 2026, conventional DRAM contract rates experienced record quarterly price jumps:
Q1 2026: Conventional DRAM contract prices surged by 93% to 98% QoQ. This single-quarter pricing spike pushed global memory industry DRAM revenues up by 81% QoQ to a total of $97 billion.
Q2 2026: Contract rates rose an additional 58% to 63% QoQ, as Tier-1 server OEMs actively outbid commercial PC buyers to secure inventory allocations.
Q3 2026: Projections indicate a further 13% to 18% QoQ expansion, demonstrating that while the rate of inflation is stabilizing, overall market pricing remains at historically elevated levels.
In spot markets, individual component tracking illustrates the speed of this trajectory. Historical pricing logs for standard 16Gb (2GB) DRAM chips showed a rapid increase from $6.84 in late Q3 to $27.20 by year-end (representing an equivalent contract baseline of $13.60/GB). Spot pricing subsequently crossed $46.88 before pushing past the $60.00 threshold in mid-2026.
The Legacy Inversion: Why DDR4 Prices Are Spiking Faster Than DDR5
A key dynamic of the 2026 memory supercycle is the pricing inversion between current-generation DDR5 and legacy DDR4 modules. Fabricators prioritized legacy 1x/1y-nanometer production lines for conversion to HBM packaging facilities. This accelerated the retirement of legacy DDR4 production lines faster than commercial enterprise migration rates.
Because industrial embedded systems, networking appliances, and legacy cloud infrastructure rely on DDR4 architectures, this abrupt supply contraction created a severe supply cliff. By Q2 2026, raw contract rates for enterprise DDR4 modules had achieved parity with—and in certain high-density configurations exceeded—equivalent DDR5 modules. B2B buyers maintaining legacy infrastructure face escalating bill-of-materials (BOM) costs despite using older component architectures.
The Memory Hierarchy Bottleneck
To contextualize this price crisis across system architectures, consider the performance and cost distribution across the standard seven-layer memory pyramid:
Registers: ~0.3 ns latency | Extremely high cost / Byte
SRAM / On-Die Cache: 1–40 ns latency | High cost / Byte
DRAM / DDR5: 50–100 ns latency | Moderate cost / Byte
HBM (High Bandwidth Memory): ~100 ns latency, TB/s throughput | High cost / Byte
NAND Flash / Enterprise SSD: 50–100 µs latency | Low cost / Byte
HDD (Mechanical Hard Drives): 5–18 ms latency | Very low cost / Byte
LTO Tape: Seconds to minutes latency | Lowest cost / Byte (<$0.005/GB)
                       The Memory Pyramid
                             /\
                            /  \  Registers (~0.3 ns)
                           /----\
                          / SRAM \ (1-40 ns)
                         /--------\
                        / Standard \
                       / DRAM / HBM \ (50-100 ns) <-- AI Capital Shift Bottleneck
                      /--------------\
                     /  NAND / SSD    \ (50-100 µs)
                    /------------------\
                   /   Hard Drives      \ (5-18 ms)
                  /----------------------\
                 /   Magnetic LTO Tape    \ (Seconds - Minutes)
                /--------------------------\
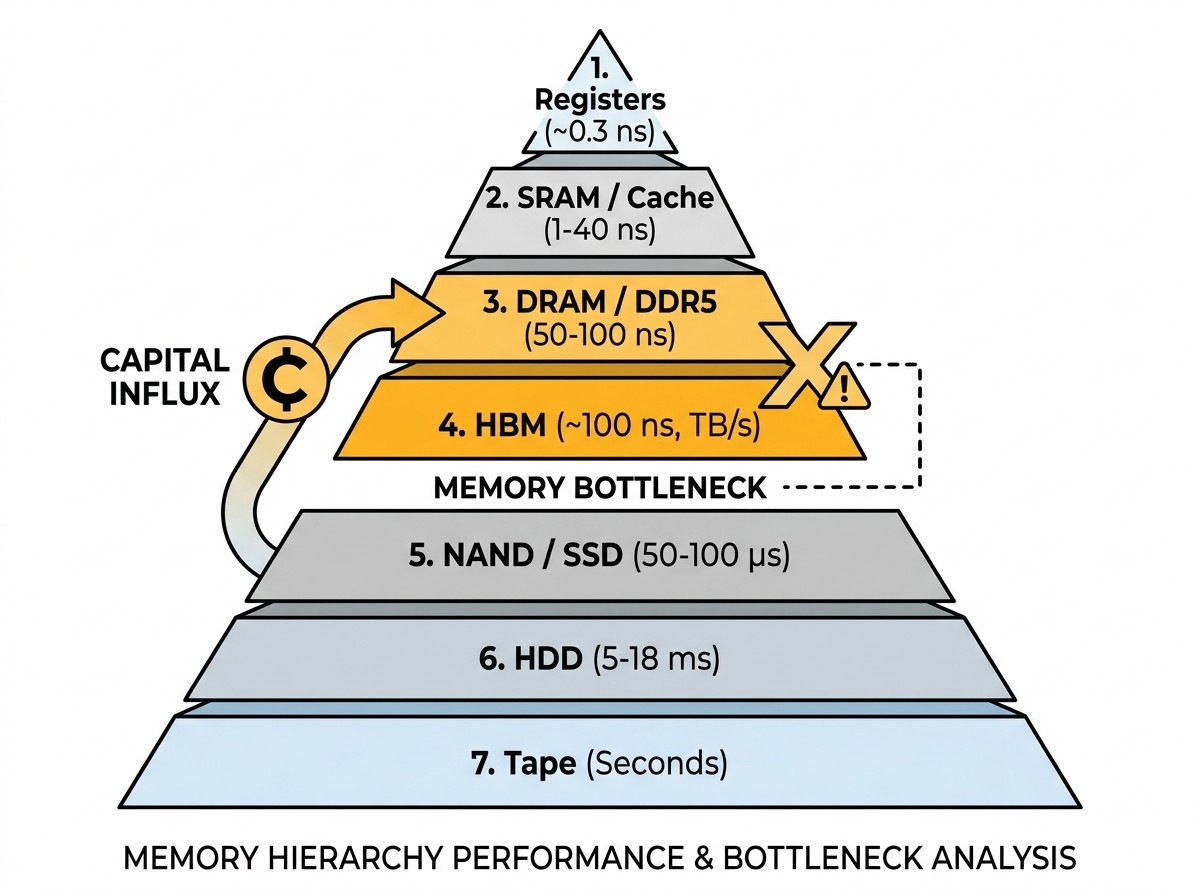
Standard DRAM and HBM occupy the middle layer of this hierarchy. Because AI applications are constrained by memory bandwidth rather than processor compute capacity, hyperscalers are directing capital into this middle tier.
As industry experts observe, "When AI applications buy out the middle of the memory pyramid, every secondary system sharing those manufacturing facilities pays elevated rates simply to route around the supply gap."
The video below provides an extensive analytical overview of how these tiers scale in speed, cost, and physical architecture under high-performance computing loads.
Every Memory Type Explained in 11 Minutes
IV. Enterprise Hardware Price Adjustments: OEM Cost Pass-Through
Component-level DRAM increases have passed directly through to enterprise hardware buyers. System OEMs are unable to absorb triple-digit component price spikes without adjusting finished goods pricing.
Enterprise BOM Impact & OEM Market Conditions (2026)
+-----------------------------------------------------------------+
| System Hardware Price Increases: 15% to 20% Baseline (PCs/Servers) |
| High-Density Server DRAM Cost Growth: +200% to +300%             |
| Lenovo Quote Validity Window: Reduced to 14 Days or Fewer       |
| Lenovo Component Inventory Holdings: Kept 50% Above Baseline    |
+-----------------------------------------------------------------+
Bill of Materials Inflation at Dell, HP, and Lenovo
Historically, system DRAM accounted for approximately 10% to 15% of the total Bill of Materials (BOM) for a standard commercial server. By mid-2026, component pricing data published by TrendForce and Uniqcli showed that memory had grown to represent over 35% of overall server hardware manufacturing costs.
Executives at Tier-1 system vendors have confirmed this shift:
Dell Technologies: Operations leadership noted that baseline DRAM component acquisition costs scaled up to 5.5 times higher over a six-month window, forcing broad structural adjustments to enterprise server catalog pricing.
HP Inc.: Official vendor procurement guidance, detailing Why Computer Component Prices are Changing in 2026, highlighted that component-level cost increases across DRAM lines necessitated direct list-price adjustments for commercial desktop, mobile workstation, and edge server families.
High-Density Server Modules: Quotes for enterprise-grade 512GB registered ECC server memory modules increased by 200% to 300%, with individual module pricing approaching $15,000 during peak Q2 pricing cycles.
System Price Adjustments in H2 2026
In response to sustained memory cost inflation, major OEMs instituted broad commercial hardware price adjustments:
Commercial PCs and Workstations: Baseline configurations for enterprise laptops and commercial desktop fleets experienced sequential price increases of 15% to 20%.
Enterprise Compute and Data Center Hardware: High-density enterprise server racks and AI worker nodes configured with terabyte-scale DDR5 pools saw list-price increases of 20% to 30%.
Truncated Quote Validity: Lenovo and Dell shortened enterprise price quotation validity windows from traditional 60-to-90-day guarantees down to 14 days or fewer. System vendors could no longer guarantee long-term pricing commitments given spot market component volatility.
Strategic Inventory Stockpiling: To buffer against ongoing allocation cuts, Tier-1 vendors altered their own inventory practices. Lenovo reported holding component buffer inventories at levels more than 50% above historic baseline norms.
Enterprise Data Center Budget Impact
These price adjustments have disrupted corporate IT capital expenditure (CapEx) planning. Procurement departments that budgeted for routine server refresh cycles in early 2026 face significant funding shortfalls.
Consequently, enterprise organizations are extending corporate laptop lifecycle rotations from 36 to 48 months and prioritizing software-level optimization to defer hardware replacements until market conditions stabilize.
V. B2B Procurement Risk Mitigation Playbook
Navigating an extended memory supercycle requires moving away from traditional Just-in-Time (JIT) procurement methods. Supply chain leaders must adopt proactive risk management strategies to maintain operational continuity and control expenditure.
Transitioning from Just-in-Time to Rolling Safety Stock
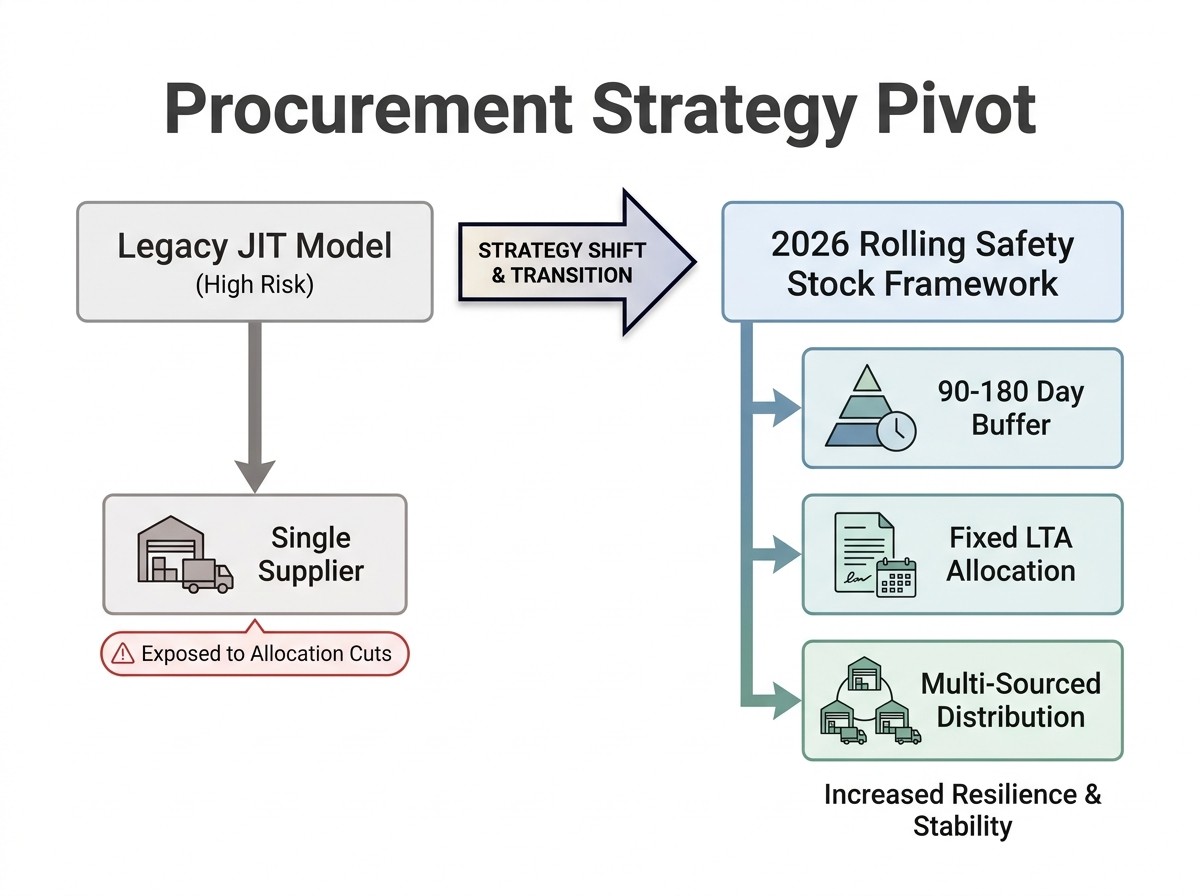
According to sourcing benchmarks from Supplyframe Commodity IQ, relying on JIT component delivery during a structural allocation phase creates significant operational risk. Enterprise procurement managers are advised to transition to a 3-to-6-month (90 to 180 day) rolling safety stock buffer for critical memory parts, server modules, and replacement inventory.
       Procurement Model Transition Path

Legacy JIT Model (High Risk in 2026):
[ Daily Demand ] ---> [ Direct Order ] ---> [ Single Supplier ]
                       (Exposed to Allocation Cuts & Price Surges)

2026 Rolling Safety Stock Framework:
[ 90-180 Day Buffer ] ===> [ Fixed LTA Allocation (9-12 Mo) ]
                            [ Multi-Sourced Distribution    ]
                            [ Active Price-Cap Corridors    ]
While holding inventory increases balance sheet carrying costs, this expense is offset by avoiding costly production line stoppages, unfulfilled customer hardware orders, and spot-market emergency purchases at 300% premiums.
Long-Term Agreements and Distributor Price Locks
To secure supply allocations, enterprise buyers are using Long-Term Agreements (LTAs) locked 9 to 12 months in advance:
Direct Manufacturer LTAs: Best suited for high-volume Tier-1 enterprise buyers requiring guaranteed monthly component volumes directly from fab lines (Samsung, SK Hynix, Micron).
Authorized Distributor Price Locks: Mid-sized enterprise buyers can leverage tier-one electronic component distributors. Authorized distributors aggregate volume demand across multiple clients to secure allocation channels and offer price-cap protection structures.
Managing Non-Cancellable Terms and Downside Price Floor Risks
During market allocation periods, component suppliers frequently enforce Non-Cancellable, Non-Returnable (NCNR) terms on volume orders. While NCNR terms guarantee physical component delivery, they expose buyers to price-floor risks if silicon production balances out and market prices drop during the contract term.
To mitigate this exposure, procurement managers should negotiate price-corridor clauses into LTAs. These clauses establish maximum price caps during allocation periods while allowing partial downward price adjustments (e.g., sharing 50% of market price drops) if spot and contract rates decline during the contractual term.
Community Perspectives on Memory Sourcing
A common consensus among enterprise managers on supply chain forums confirms that unhedged buyers relying on open distribution channels face significant challenges.
Engineers and procurement specialists report that uncommitted component quotes are subject to daily price changes, with order leads extending from standard 4-week turnarounds to over 24 weeks. Buyers who secured distributor price locks in early 2026 have maintained supply continuity, whereas organizations relying on spot market purchasing face significant budget overruns.
VI. Decision Framework: Evaluating Procurement Hedging Strategies
To assist enterprise procurement officers and supply chain executives in selecting the optimal sourcing framework during the 2026 memory supercycle, the matrix below compares primary procurement strategies:
| Sourcing Strategy | Lead-Time Guarantee | Price Predictability | Downside Risk | Capital Commitment | Recommended Use Case |
|---|---|---|---|---|---|
| Spot Market Sourcing | Low Subject to allocation cuts | Very Low Exposed to market surges | Low No long-term commitments | Minimal Upfront cash | Unplanned short-term demand spikes or non-critical repairs |
| Fixed-Price Long-Term Agreement (LTA) | High Guaranteed volume commitments | High Price cap established | High Risk of overpaying if market drops | High Contractual volume obligations | Core production lines with predictable 12-month build volumes |
| 3-to-6-Month Rolling Safety Stock | Very High On-hand inventory | Medium Averages market price changes | Medium Inventory carrying costs | Medium Capital tied up in buffer inventory | Mission-critical enterprise hardware platforms |
| Distributor Price-Lock Agreement | High Allocated distributor volume | High Capped procurement cost | Low-Medium Subject to negotiated NCNR terms | Low-Medium Managed vendor inventory schedules | Mid-sized OEMs and enterprise IT infrastructure buyers |
VII. Summary & Practical Checklist
The global standard DRAM shortage in 2026 is driven by physical silicon real estate constraints. The 3-to-1 wafer trade ratio required by HBM3e and HBM4 packaging permanently reallocates cleanroom capacity away from conventional planar DDR4 and DDR5 fabrication lines. As a result, enterprise buyers face structural price inflation, shorter quotation validity windows, and longer lead times across server and workstation hardware.
Actionable B2B Sourcing Checklist
[ ] Audit Memory Inventory Exposure: Identify all active server, workstation, and embedded deployments currently dependent on constrained DDR4 and high-density DDR5 modules.
[ ] Shift from JIT to Buffer Stock: Establish a 90-to-180-day rolling safety stock buffer for high-turnover memory components and replacement units.
[ ] Lock In 9-to-12 Month Allocations: Formalize Long-Term Agreements (LTAs) or authorized distributor price-lock arrangements to guarantee supply channels.
[ ] Incorporate Price-Corridor Clauses: Ensure NCNR agreements include flexible price-adjustment mechanisms to mitigate downside price-floor risks.
[ ] Shorten Quote Windows for End-Customers: Align internal sales quote validity periods with OEM standards (14 days or fewer) to protect operating margins against sudden component price shifts.
Recommended Market Analyses & Further Reading
To evaluate broader historical memory cycles and long-term pricing trajectories, consult The 2026 Memory Super Cycle: Navigating Price Surges in DRAM and NAND Flash.
For detailed component inventory planning and buffer stock calculations, read the In-Depth Analysis of Q1 2026 Memory Chip Market Stocking Guide.
Frequently Asked Questions
1. What exactly is the "3-to-1 rule" in DRAM manufacturing?
The "3-to-1 rule" describes the physical manufacturing trade-off where producing one bit of High Bandwidth Memory (HBM3e) consumes roughly three times the 300mm silicon wafer area required for standard DDR5. This penalty is driven by larger die footprints (50% to 60% larger due to Through-Silicon Vias), dedicated base logic dies, and compounding yield losses across vertically stacked die layers.
2. Why are legacy DDR4 prices rising as fast as modern DDR5 memory?
Fabricators have converted legacy 1x/1y-nanometer DDR4 manufacturing lines to handle HBM packaging and advanced lithography processes. This rapid reduction in DDR4 production created a sharp supply drop, forcing prices upward for enterprise and industrial users who still depend on legacy DDR4 infrastructure.
3. How much are major computer manufacturers raising enterprise hardware prices in H2 2026?
Tier-1 system manufacturers including Dell, HP, and Lenovo have implemented 15% to 20% price increases on standard commercial PCs and servers. High-density server configurations requiring terabyte-scale DDR5 configurations have seen price increases of up to 30%, with vendor quotation validity windows reduced to 14 days or fewer.
4. What are the risks of signing fixed-price Long-Term Agreements (LTAs) during a price peak?
The primary risk is locked-in price floors. If market capacity stabilizes or demand softens, a buyer bound to a fixed-price NCNR contract risks paying above-market rates. Buyers can mitigate this risk by negotiating price-corridor clauses that allow partial downward price adjustments if spot rates drop significantly.
5. How large should a rolling safety stock buffer be during the 2026 memory supercycle?
Supply chain experts recommend maintaining a 3-to-6-month (90 to 180 day) rolling safety stock buffer for critical memory components. This buffer insulates production lines and enterprise hardware refresh cycles from unexpected allocation cuts and extended lead times.
References
 UTMEL
UTMEL
We are the professional distributor of electronic components, providing a large variety of products to save you a lot of time, effort, and cost with our efficient self-customized service. careful order preparation fast delivery service
 High-Capacity HDDs in the AI Era: Sourcing Massive Storage for Cold DataUTMEL04 July 2026653
As generative AI and LLMs drive an explosion of unstructured data, high-capacity enterprise HDDs remain the most cost-effective solution for cold storage. Despite rising prices and supply chain bottlenecks, mechanical drives offer a massive cost-per-gigabyte advantage over SSDs. Technologies like HAMR and SMR enable capacities beyond 24TB, though deploying these drives requires robust RAID 6 strategies and secured IC supply chains to mitigate rebuilding and procurement risks.
Read More LPDDR5 Memory 2026: Lead Times, HBM Impact, and Procurement StrategiesUTMEL17 July 20264088
Global semiconductor fabrication facility managing advanced memory production. In Q2 2026, contract prices for 12GB LPDDR5X modules surged 89% quarter-over-quarter, jumping from $77.10 to $145.90, while lead times for advanced memory components stretched to 40–58 weeks. A vehicle platform designed in 2023 with specific memory requirements must ship in 2026, regardless of spot market conditions.
Read More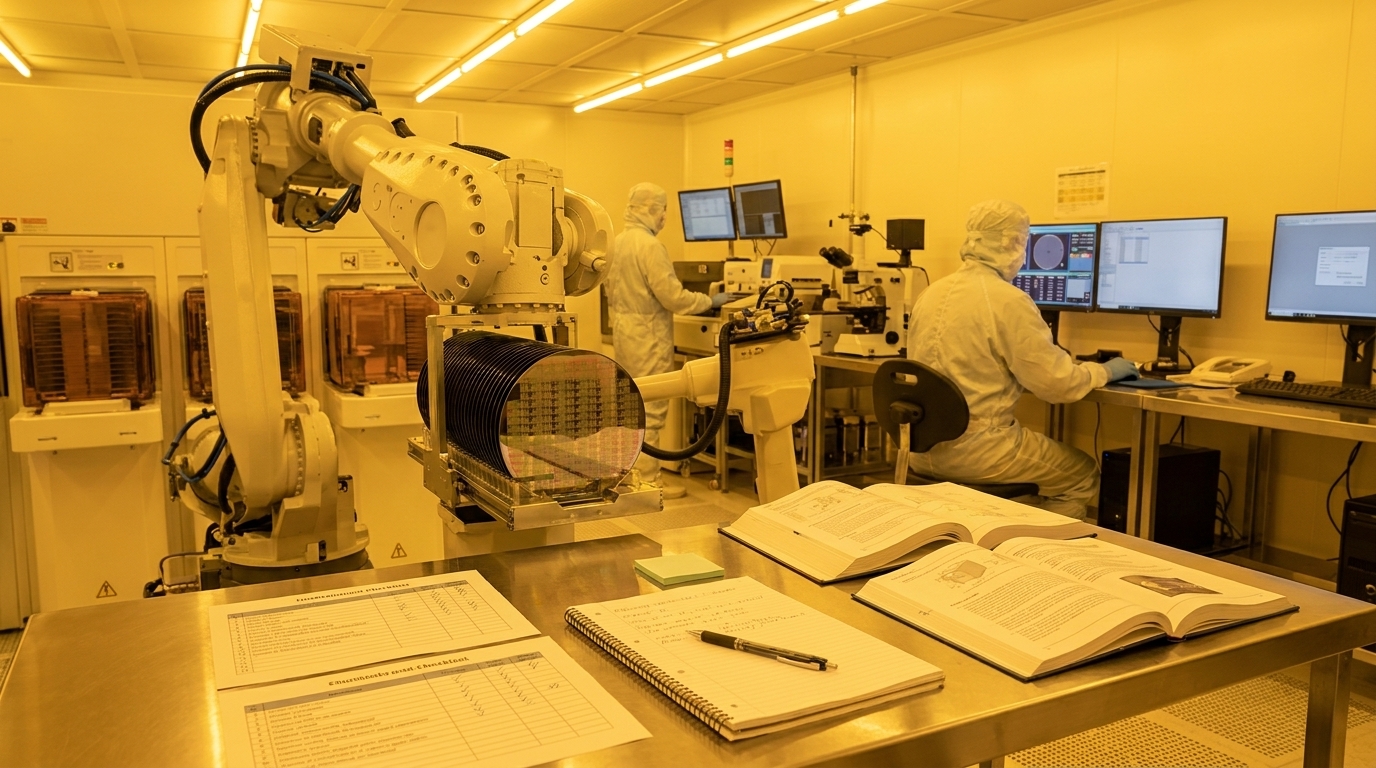 2026 DRAM and the 3-to-1 HBM Rule: Market Supply Analysis and B2B Procurement GuideUTMEL23 July 20265371
This technical report explains how the physical "3-to-1 wafer penalty" of High Bandwidth Memory (HBM) production has cannibalized standard DRAM capacity, causing severe shortages of DDR4 and DDR5 in 2026. As major hardware OEMs pass these soaring component costs directly to enterprise buyers, procurement teams must abandon Just-in-Time models in favor of rolling safety stocks and strategic long-term distributor agreements to protect budgets.
Read More Automotive vs. Industrial Memory: How to Verify Grade Codes Before Sourcing In this guideUTMEL06 August 2026417
Memory ordering codes can look almost identical while representing different temperature limits, packages, revisions, qualification evidence, or lifecycle commitments. For automotive and long-life industrial designs, the safe purchasing unit is the complete manufacturer ordering code, not a base part number plus a familiar-looking suffix.
Read More How to Use an External Hard Drive?UTMEL24 June 20219418
The external hard drive is a compact and portable hard drive storage which can be plugged in or unplugged at any time. It mainly uses USB or IEEE1394 interfaces. It can transmit data with the system at a higher speed. The IEEE 1394 interface transfer rate is 50-100 MB/s.
Read More
Subscribe to Utmel !
![32316]() 32316
32316Parallax Inc.
![BOOK GAN FET]() BOOK GAN FET
BOOK GAN FETEPC
![90001265-88]() 90001265-88
90001265-88Digi
![27220]() 27220
27220Parallax Inc.
![GAN FET BOOK SIMPLIFIED CHINESE VERSION]()
![BOK-09613]() BOK-09613
BOK-09613SparkFun Electronics
![GAN FET BOOK - DC/DC]()
![28125]() 28125
28125Parallax Inc.
![B000003]() B000003
B000003Arduino
![122-28176]() 122-28176
122-28176Parallax Inc.